I want random data! But…I want them to be distributed normally!
The ability to generate random data that are normally distributed is very useful. Here’s how you do it in Javascript:
function rnd(mean, stdev) {
	var snd = (Math.random()*2-1)+(Math.random()*2-1)+(Math.random()*2-1);
	return Math.round(snd*stdev+mean);
}
//this function generates one value; iterate in order to generate a large population of values
FYI
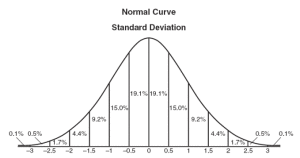
This is normal distribution:
E.g. test grades are normally distributed: very few students will do extremely well or do extremely poorly. Many more students will have grades that are closer to the mean grade. So, grade frequency clusters around the mean.
FUN FACT
Did you know that, though perhaps you’ve seen “histogram” and “bar chart” used interchangeably, histograms in fact represent values’ frequencies whereas bar charts represent values’ magnitudes⸮
anyways
To generate the histogram above, I used that JS function to generate 100 data points. I set the mean to 50 and the standard deviation to 15. For example, I might generate [48,52,17,41,65,58]. I then determined a set of value ranges and counted how many data points fall into value range, e.g. 0-10 has 2 data points. 10-20 has 3 data points. 20-30 has 3 data points. Etc. Then, finally, I increased the height of each bar in the histogram in relation to the number of data points that fall into that category.
